Part 1 | Value Investing vs. Growth Investing - 05/09/2020
We believe it is very difficult to predict market trends, call market bottoms or market tops, or forecast future economic developments. We have never seen anyone do it consistently well. Our approach is more aligned with Lao Tzu, a 4th century Chinese philosopher, who said:
“Those who have knowledge, don’t predict.
Those who predict, don’t have knowledge.”
While we don’t forecast market trends, we can’t help thinking about a possible reversion to the mean for the value factor. For the past 13 years value stocks have underperformed growth stocks on a relative basis. This “Buy Digital, Sell Analog” investment theme has done remarkably well for an extraordinary length of time. Such a sustained period of value underperformance is historically unprecedented. Something many of our clients may not be fully aware of.

To give you an idea of the headwind value investors have faced over the past decade plus, above is a 25-year graph of the relative performance spread of the Russell 1000 Growth (left scale - white line) vs. Russell 1000 Value (right scale – green line).
We were struck by how extreme this relative performance comparison looked at year end 2019. And just when we thought it couldn’t get more extreme, COVID-19 surprisingly punished value harder than growth.
Given the relative price performance pictured above, we were surprised by the chart below sent to us by a colleague. It compares the growth in earnings for the Russell 1000 Value Index to the growth in earnings of the Russell 1000 Growth Index. Note this is not a chart of the price performance. It is a chart of the growth in earnings of the 1000 largest publicly traded companies underlying the respective indices.
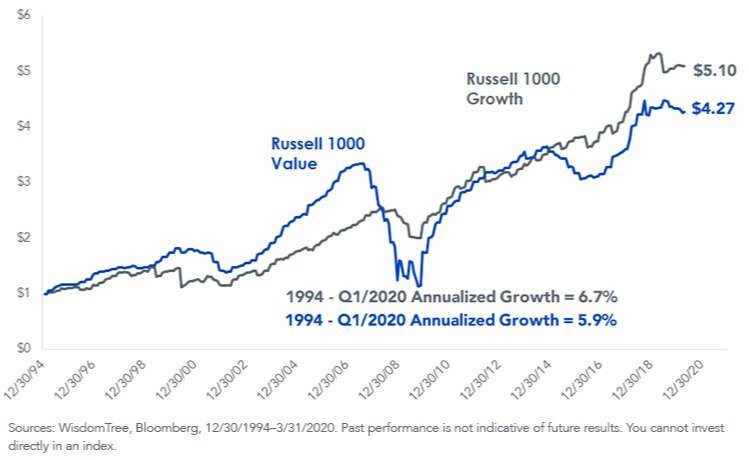
The revelation for us is that the difference in earnings growth rate between the two indices is only .80%. Just 80 basis points. Looking at these two charts together, there is a disconnect that begs a few questions, such as:
Why have growth stocks and values stocks with similar earnings growth rates seen such an extreme divergence in performance?
How should investors price earnings growth of 5.9%?
How much should investors pay for growth of 6.7%?
And as a baseline, how should investors value consistent earnings that are not growing at all?
Investing is both an art and a science. Applying some science to the task, we think using a model called the “Justified P/E” ratio might be appropriate in this context. As Neil Ferguson might admit, models are in no way perfect. We don’t know anyone who uses this formula, including ourselves. As far as we can tell this formula sits mostly unused in dusty finance textbooks and dog-eared CFA curriculum study guides. However we think it provides a useful framework for “pricing growth.”
Basically, the Justified P/E uses the Gordon Growth Model to calculate the P/E ratio a company should trade at — given an expected level of growth and a required level of return.
First, we choose what rate of return we require to justify putting our capital at risk. For simplicity’s sake and given how many sleepless nights we’ve had in March and April, we suggest that in the current market equity investors should be targeting 12% returns. But don’t get hung up on that number, it is used to illustrate the exercise. In the example below, to simplify the formula, we assume all earnings are paid (not retained) as dividends.
The Justified P/E Ratio formula:
What price/earnings multiple should we pay for a base level of $1.00 of earnings that is not growing at all?
1 * (1 + 0) / .12 - 0 = 8.3
Under this scenario, using the required return of 12%, a theoretically fair price to pay for this zero-growth earnings stream is 8.3 times.
If 8.3x is the baseline P/E for zero growth of that $1.00 of earnings, what multiple of earnings should we pay for the Russell Value 1000 Index, assuming the 12% required return?
1*(1+.059) / .12-.059 = 17.36
The formula calculates a fair value for the Russell Value Index of 17.36 times earnings.
Finally, what multiple should you pay for $1.00 of earnings for the Russell Growth Index, again assuming a 12% required return?
1*(1+.067) / .12-.067 = 20.13
The formula produces a fair value for the Russell Growth Index of 20.13 times earnings.
It is not surprising that, given the relatively small difference in earnings growth between the two indices, the Justified P/E Ratios are relatively close at 20.13x (Growth) and 17.36x (Value).
Let’s look at where these indices are currently trading in a world of unicorns, puffy vested venture capitalists, and electric scooters promising to solve the “last mile” challenge that our legs evidently couldn’t handle. Behold the valuation gap — with Growth (white) at a P/E of 28, and Value (green) at 15. The only period where the gap was larger was during the “dotcom melt-up" that ended quite badly for the growth momentum players.

Armed with these observations, how do we capture the value discount opportunity and turn it into a win for our clients? For this discussion we direct your attention below to a chart from our friends at Verdad Capital — who regularly crank out insightful pieces on a variety of value-oriented topics. The chart maps the price to cash flow (P/CF) history of a value sub-sector known as “Deep Value” — the value tier with the lowest P/E’s, P/CF multiples, typically comprised of smaller cap companies.

As you can see, the punch bowl emptied for the last deep value party in 2015. It lasted for a good 5 years coming out of the “Great Recession,” when the P/CF multiple for deep value stocks crashed to below 3x. Deep Value investing is Caldwell Sutter’s core strategy. It is a focused approach that we have pursued through market cycles dating back to 1982. Not quite as far back as 1969, when perhaps the greatest value investor of all time refused to accept new capital because P/CF multiples at 7.4x where too high a price to pay. We suspect the circa 1960’s version of Buffett, with his smaller bucket of capital ($700m in today’s dollars) would love to be presented with the small cap value opportunities we see today at 2.6x P/CF multiples.
Should history repeat, or even remotely resemble the lines of this chart, we favor our chances over the next 5 plus years. We believe for value investors, having this time horizon sets up a future of potentially strong absolute risk adjusted returns without having to count on a reversion to the mean for value investments relative to growth. Although a value factor tailwind would certainly be a nice change.
We appreciate the time you invested in getting to end of this piece. All thoughts and feedback are welcomed. Thank you and please stay tuned for a follow up insight piece where we dive further into defining Deep Value and how Caldwell Sutter Capital selects individual securities, manages client portfolios, and generally thinks about prudent investing.